Why was this Analysis Conducted?
Evaluating transportation disadvantage provides a data driven approach to understanding distribution of transportation networks, services, and projects. This data provides opportunities to create real choices in where people live and how people travel for all of our residents, across age, race and ethnicity, economic means, and ability.
What Does it Mean to be Transportation Disadvantaged?
People who are transportation disadvantaged experience challenges achieving basic access to services, employment, and/or education. Not only do socio-demographic characteristics factor into being transportation disadvantaged, but also where people live and what travel options are available to them.
Transportation Disadvantaged Population Analysis
An analysis was conducted for Transportation Disadvantaged Populations using several census data sets. These population characteristics include:
- Low-moderate income households
- People who have low-moderate income may not have the resources to own/maintain a personal vehicle, which on average costs $6,060 – $8,743 per year, and need to rely on public transit or others to provide rides. (AAA, 2019)
- Minorities
- There is a link between ethnicity and pedestrian deaths. Minority populations are less likely to own a vehicle and more likely to walk, bicycle and/or use public transportation, resulting in greater exposure to the dangers of the street. (Surface Transportation Policy Project, 2002)
- Households with an individual with a mobility disability
- There is a legacy of infrastructure and systems that do not accommodate people with impaired mobility, thus causing people to have to expend more energy, time, and money to access services. (Natural Resources Services – A Division of Redwood Community Action Agency, 2006)
- People who have less than a high school education
- Having less than a high school education is linked to a variety of negative health impacts, including limited employment prospects, low wages, and poverty. (Office of Disease Prevention and Health Promotion, 2020).
- Single parent households
- Single parent households typically earn significantly less than two parent households and children in single parent households are more likely to live in poverty. Further, 33% of single parent families in 2013 were “food insecure”. (The rise of single parent households, 2019).
- Households without vehicles
- When people do not have a personal vehicle they must walk, bike, use public transportation, or obtain a ride from others. This puts people in potential conflict with auto drivers unless the proper infrastructure is provided.
- Youth (under 18) and Senior citizens (65+)
- One of the most significant non-driving populations are those who are too young to be licensed to drive. Even being old enough to obtain a driver’s license does not guarantee access to a vehicle, especially for youth from low-income families. Low-income children face an increased exposure to many risk factors since affordable housing is often located along high-speed, high-volume streets, in neighborhoods that lack parks, playgrounds and access to other safe places to play. The number of people over 65 is continually growing. Alternatives to driving are necessary for seniors as they loose the ability to drive due to either sight or mobility losses. (Natural Resources Services – A Division of Redwood Community Action Agency, 2006)
The data sets referenced above are from the U.S. Census Bureau. The low-moderate income data is from the U.S. Department of Housing and Urban Development’s Community Development Block Grant (HUD’s CDBG) 2015 American Community Survey 5-year Estimates, while the rest of the data is from the 2018 American Community Survey 5-year Estimates.
The Lawrence average was found for each topic except for income, which was not categorized based on a Lawrence average because income data is provided by the U.S. Department of Housing and Urban Department and has a specific Community Development Block Grant (CDBG) threshold (areas with at least 51% of income considered low-moderate income).
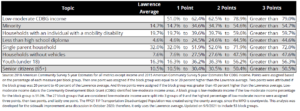
LAWRENCE TRANSPORTATION DISADVANTAGED POPULATION SCORING TABLE
One point was assigned if the block group was equal to or 20 percent higher than the Lawrence average. Two points were attributed if the block group was 20 percent to 40 percent of the Lawrence average. And three points were assigned if the block group was greater than 40 percent higher than the Lawrence average. This is shown in the table. Click on the image or here to see it larger.
As the income data didn’t have a Lawrence average the 27 block groups were split into three groups to match the point thresholds. The group with the highest amount of low-moderate income people received three points.
Transportation Disadvantaged Population Scores which are higher correlates to additional scrutiny necessary to ensure these populations are not disproportionately affected. Click on the map image to see the map as a larger pdf.
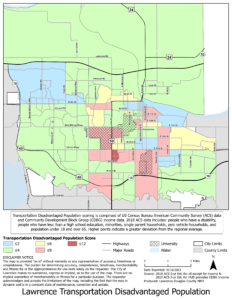
LAWRENCE DISADVANTAGED POPULATION MAP (PDF)
To view this information as a 4 page handout click here.
Sources:
- AAA. (2019). Your driving costs how much are you really paying to drive? https://exchange.aaa.com/wp-content/uploads/2019/09/AAA-Your-Driving-Costs-2019.pdf. Utilizing data for driving 10,000 miles per year.
- Surface Transportation Policy Project. (2002). Mean streets. http://www.transact.org/wp-content/uploads/2014/04/Mean_Streets_2002.pdf
- Natural Resources Services – A Division of Redwood Community Action Agency. (2006). Humboldt county transportation-disadvantaged populations report (pp. 16–20). http://www.nrsrcaa.org/path/pdfs/HumCoTDPReport5_06.pdf
- Office of Disease Prevention and Health Promotion. (2020). High school graduation | healthy people 2020. High School Graduation. https://www.healthypeople.gov/2020/topics-objectives/topic/social-determinants-health/interventions-resources/high-school-graduation#4. Accessed on May 11, 2021
- The rise of single parent households. (2019, October 21). AU Online. https://online.aurora.edu/single-parent-households. Accessed on May 11, 2021